Business sector
Contact centers
Business goal
To have the possibility to visually assess how employees work with service requests
Problem
Hard to track quantitative metrics for customer requests and qualitative metrics for operators' work.
Tags: no structuring, Excel is not enough, CRM, reports
Solution
Users process clients' orders in the Deal cards. First, we need to implement the feature that lets indicating the type of request:
1. Go to CRM → Settings → Form and report settings → Custom Fields → Deal → Fields.
2. Add a new field and set the necessary parameters, for example, if the field is required, and whether it should be shown in the list. Select a type, for example, list, and design.
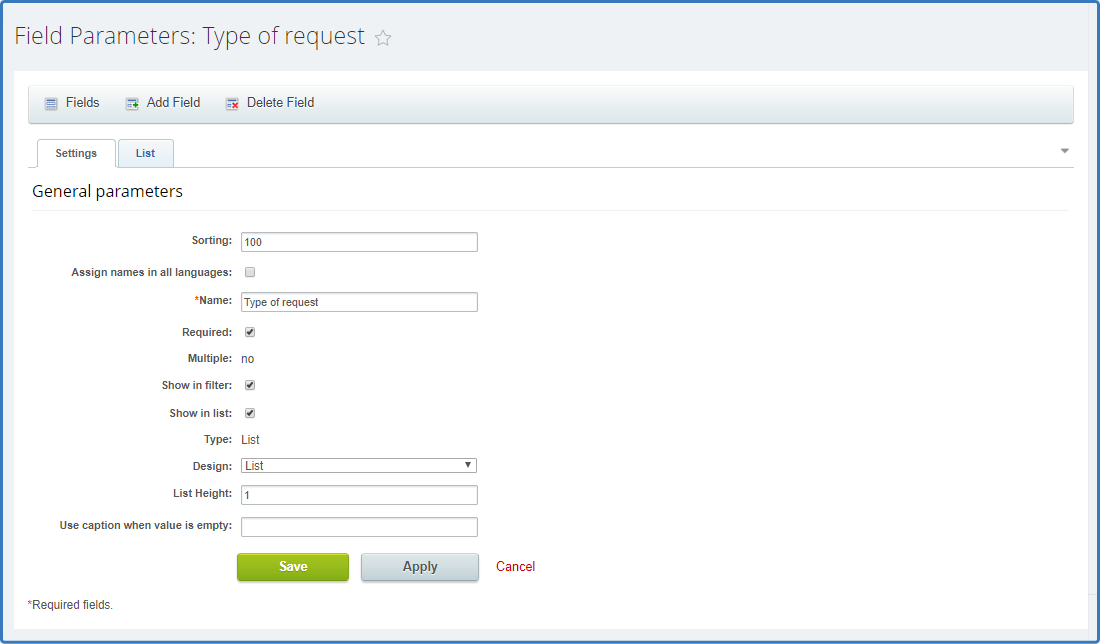
Custom field settings window in CRM
3. Save changes. Open the newly created field, go to the List tab and add the required number of request types (for example, Repair and Maintenance, Warranty issues, etc.).
4. Click Save.
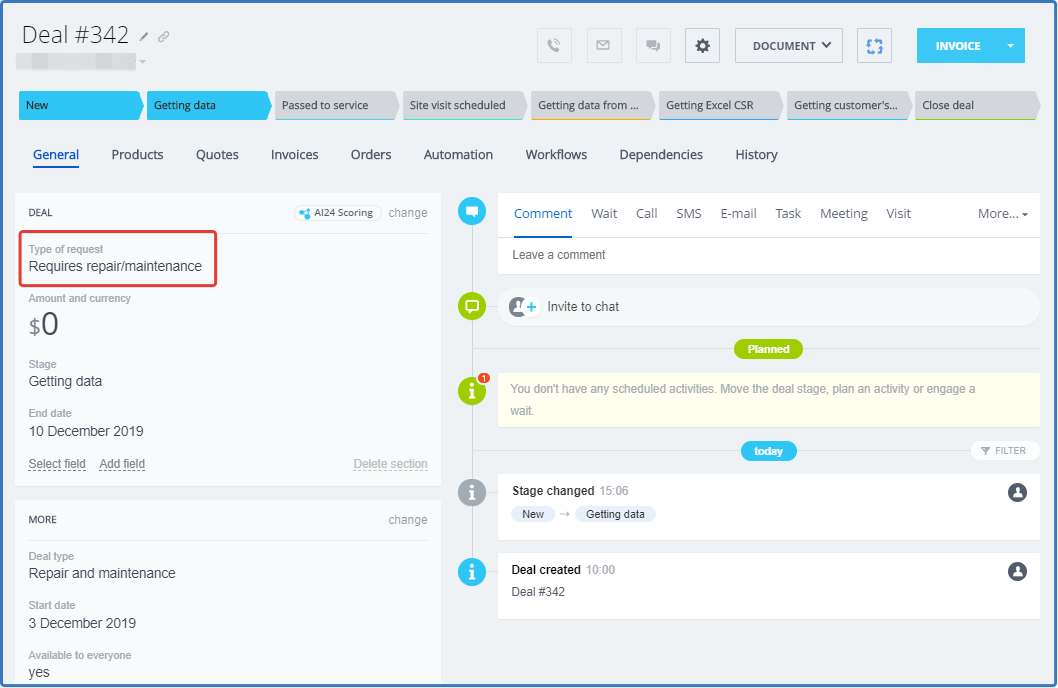
The Deal card indicating the type of request
Then, let's set up two types of reports: by request types and by deal stages.
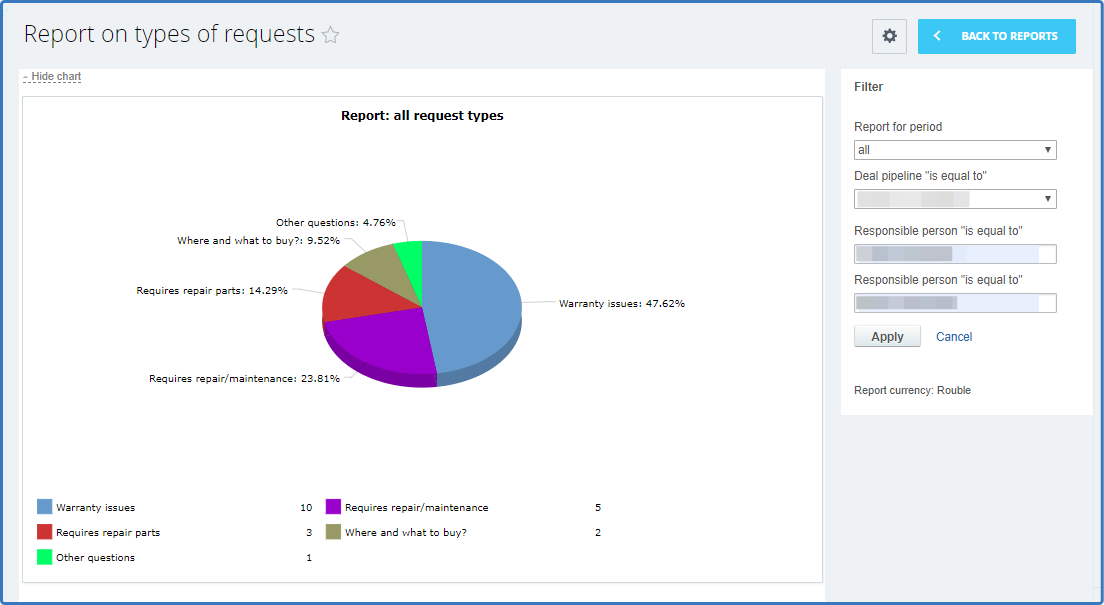
Report on types of requests:
-
Go to CRM → Reports → Add report.
-
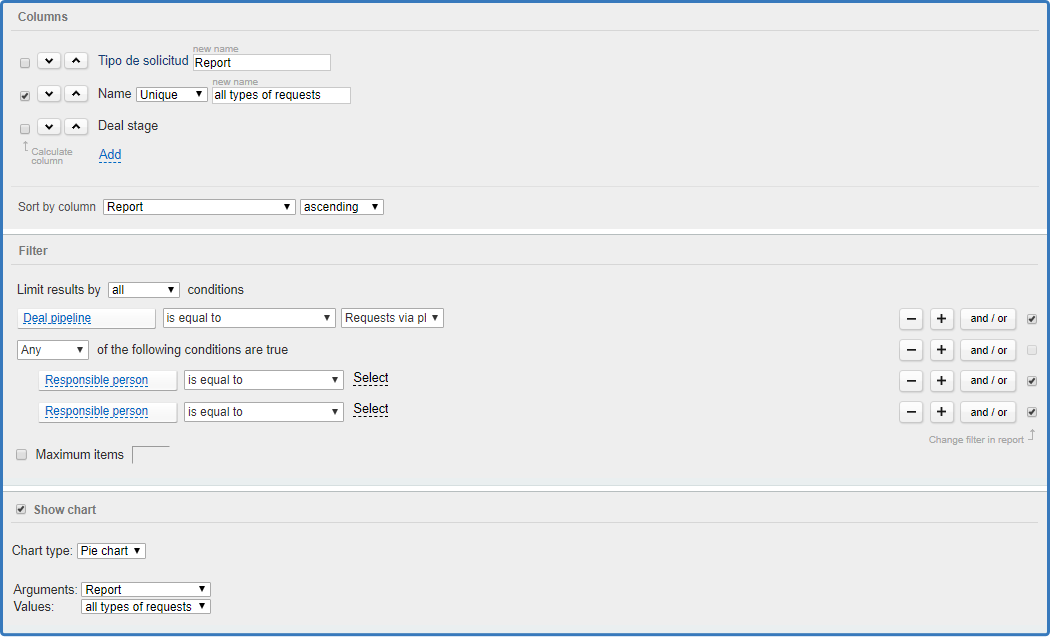
In the Columns section, set two parameters: Type of request and Name (Unique).
-
In the Filter section, set the Deal pipeline and a condition for the responsible person. The condition should be added as many times as the number of employees you want to include in the report.
-
Check the field Show chart and select a suitable type (for example, a pie chart).
-
Save the report.
To filter the finished report by the responsible person, select the needed employees on the right panel.
Also, in the Column section of the report settings, you can add the Deal stage parameter. Then, below the chart, there will be a table with the data on how many deals each employee currently works on, what type of requests the deals belong to, and at what stage they are now. If a responsible person is not specified, the same data can be viewed for all deals.
For clarity and ease of perception, let's configure a report on deal stages. You can copy the standard report on deals distribution by stages and configure it at your liking, or you can create a new report.
Report on deal stages:
-
Go to CRM → Reports → Add Report.
-
In the Columns section, set two parameters: Name and Deal stage.
-
In the Filter section, set the Deal pipeline and a condition for the responsible person. The condition should be added as many times as the number of employees you want to include in the report.
-
Check the field Show chart and select a suitable type (for example, a pie chart).
-
Save the report.

To filter the finished report by the responsible person, select the needed employees on the right panel.

Thus, company employees can see:
-
what type of requests dominates all others (for example, the company gets more requests for warranty repairs than complaints about the quality of goods);
-
how many deals are in progress;
-
what type of requests they belong to;
-
how many deals each operator has closed.
Reports on types of requests and deal stages reach two main goals:
1. to track how many requests the company received for a specific period, at what stage they are now, and how many deals were successfully closed;
2. to assess the work of operators and compare their performance: how many deals each operator closed, how many requests have not been processed yet, what type of requests the operators deal with most often.